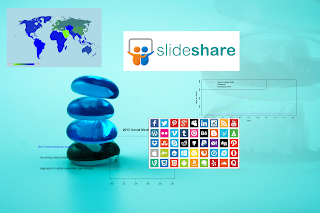

The post illustrates how to compile, analyze and present information on the global social media landscape. The exercise is being implemented at present using a variety of methods and tools. The idea is to demonstrate that the most elegant approach is through the use of statistical frameworks. In the case of the social media landscape this naturally involves identifying or constructing a statistical framework for social media landscape aggregates. Luckily for us, an excellent, if not the best, framework is outlined in the One Hundred Stats About Social Media Around the World SlideShare by Heike Young from Salesforce MarketingCloud published on September 2, 2014.
Social Media is an exciting field of internet research
because of the market related technological developments taking place. This is
best summarized on slide two of the One Hundred Stats About Social Media Around
the World SlideShare.

The first consideration is the Internet of Things. The evolution of the market trend can be summarized with slides 4 and 6 of the We Are Social Internet of Things SlideShare published on November 12, 2015.


From a content marketing point of view it is important to keep in mind a key foundational consideration on slide 19 from the We Are Social Social Mix SlideShare published on July 15, 2015.

In this light the next logical step is that highlighted on slide 22.

The extension of these considerations to the digital and mobile statistics is highlighted in slide 10 of the Ericsson Mobility Report June 2015 SlideShare published in June 2015 about how technologies are enabling the Internet of Things.

A key core aspect of a group of statistics is the framework within which to analyze them and ultimately generate customized statistical content from them. The common statistical methods involve survey sampling and model building. In both approaches it is imperative to define a statistical population.
In our context the best population is the global population.
The advantage of the choice statistically is housed within the aggregate’s survey
sampling error properties and the Law of Large Numbers. The other advantage is from the collection
and compilation perspective. The compilation of aggregate estimates and their
comparisons is generally easier than compiling regional sub-populations in the
beginning of a statistical collection. In the life cycle of the sample survey, however,
this compilation process feature changes because the usual practice is to use the
information on the sub-regional populations to generate the aggregate estimate.
The second key advantage is from a methodological point of view. In my experience with statistical modeling, it is usually easier to think of an aggregate population and any sub-populations as components of the aggregate when generating models.
The third advantage is that once compiled the global
aggregate is easier to track and report on.
The fourth advantage is that population information
requirements that require dis-aggregation can be formulated within the
methodology of the aggregate.
The fifth advantage is that when the generated model
information (or output) has to be blended into a content marketing framework (for
writing, e-learning communication or e-business purposes) it is a good idea firstly
to choose a population model with the strongest empirical basis as a foundation.
The second consideration is to choose a model form that is amenable to analysis
with (or has advantages when analyzed with) statistical software.
Our list and its related content, SlideShares, blogposts,
reports, academic papers, databases and other information in this post illustrate
these five statistical advantages in our choice of the aggregate global
population as a our population.
Once the main population is specified the next step is the
statistical methodology and the data. The data and statistical methodology sources
for our list are the Internet World Stats website,
100 Stats About Social Media Around the World SlideShare, Ericsson Mobility Report June 2015 SlideShare, We Are
Social Social Digital and Mobile Around the World (January 2014) SlideShare (published on January 7, 2014) and the We Are Social Digital, Social and Mobile in 2015 SlideShare (published on January 20, 2015). The 100 Stats About Social Media Around the
World SlideShare global population is the main population for our list model
and the remaining SlideShares are supporting data for harmonizing the
information from the model with other sources.
The next critical step is to chooze a modeling software
portfolio to perform all the statistical modeling operations on the data or
information. In this analysis the software used in the Revolution R Open free software from Revolution Analytics.
2014 Global population
The starting point for our list is the global population
social media stats from the 100 Stats About Social Media Around the World SlideShare.


This information can be incorporated into the Revolution R Open software and presented using a dotchart. The dotchart allows for the representation of aggregates on the same scale. This feature of the dotchart is key to our modeling as will be illustrated in the conclusion of the post.

The figure can in turn be compared and characterized with aggregates from the We Are Social Digital and Mobile Around the World (January 2014) SlideShare.

The One Hundred Stats About Social Media Around the World SlideShare statistical aggregates fall into three spatial aggregation levels, namely, global, regional and individual country levels. It would be useful to obtain a quick summary of the regional structure of the population to supplement the global information. This information is available from slide 6 of the We Are Social Digital and Mobile Around the World (January 2014) SlideShare.

This information can be read with a spatial classification into the Revolution R Open googleVis package and represented using the gvisGeoChart function. In the function a colour ramp needs to be specified to represent the values of the aggregates. For our purposes the first important feature of the function is that it allows for the representation of data at the country, regional and global level. The second and critical feature is that as in the dotchart the analysis variable is represented a colour representing a value on the real line.
The related regional information from the We Are Social
Digital and Mobile Around the World (January 2014) SlideShare that can be
incorporated into our modeling scheme of the aggregate contains the
dis-aggregation of four variables of the global population. The map of the
population regional aggregates (percentage form).

The map
of the internet user regional aggregates (percentage form).

The map of the active social media accounts regional aggregates (percentage form).

The map of the mobile connections regional aggregates (percentage form).

The the 2015 global population can be further dis-aggregated to the individual country level. The dis-aggregated values can be used to calculate country population based weights for each country using the formula (for say N countries):
The resulting weights for all the countries can be mapped using the gvisGeoChart function.

The remainder of the aggregates in the list are arranged into country aggregates grouped by regions. The regional groups are more aggregated and distinct from the eleven regional groupings in slide 6 of the We Are Social Digital and Mobile Around the World (January 2014) SlideShare.
Americas region (Brazil, Canada and USA)
The first group of 2014 country aggregates are the total population, total internet users, active social media users and the average time of daily social media use. The aggregates are good for establishing very general country-based social media consumption pattern profiles across the global social media landscape. The data and pattern profiles can be incorporated into our global population modeling and content marketing scheme. It is also important to note that the dotchart allows for simultaneous multiple aggregate variable comparisons on the same scale (on the real line).

The one observational highlight is that in 2014 people from Brazil spent on average more time daily on social media than people from Canada and the USA.
The social media (user) profiles for access in the past
month for 2014 of the three countries were very similar. Facebook had the most
users accessing over the past month followed by Twitter, Pinterest, Google+ and
Instagram.

The 2014 social media (user) profiles for account ownership were very similar for Canada and USA. The profile for Brazil was shifted to the right (i.e. more users) with the second and third networks (Twitter and Google+) being closer to the Facebook percentages.

The 2014 population profiles for social media apps use were very different in aggregate terms between the countries with the USA having the most people, followed by Brazil and then Canada.

The country snapshots of related/model harmonization aggregates for USA, Canada and Brazil from the We Are Social Digital and Mobile Around the World (January 2014) SlideShare.


In the modeling framework these can be thought of as control totals or harmonization figures. In non-technical terms the figures are controls for the model output, namely, they should convey the same empirical message as the model output (taking into account time or modeling assumptions).
The second group of 2014 country aggregates are as in the
case of the Americas the total population, total internet users, active social
media users and the average time of daily social media use. In general people
from the UK spent more time on average daily on social media than people from
France and the Sweden.

The important aspect to note of the dotchart output is that the second group of aggregates and the first group of aggregates can be represented on the same scale in one chart as real line quantities. This is important for making simultaneous comparisons of the aggregates in a standardized format.
The third group of 2014 country aggregates are the total population,
total internet users and active social media users for Denmark and Norway. In
general the two countries had similar internet and social media users to
population percentages.

The two graphs show that in 2014 France had the most number of internet and social media users.
The fourth group of 2014 country aggregates are the social
network profiles for the UK, France and Sweden. Facebook was the network with
the most users across all three countries. Twitter was network with the second
most in the UK, Pinterest in France and Instagram in Sweden.

In terms of internet users with social network user accounts by country for 2014, Facebook had the highest percentage in all three countries. Twitter was the network with the second most in the UK, Pinterest in France and Instagram in Sweden.

In terms of the 2014 internet users who owned social media accounts in Denmark and Norway, Facebook had the highest number of users in both countries, LinkedIn was network with the second most in Denmark and Spotify in Norway.

In terms of 2014 social media users accessing social media using mobile phone, the UK had the most, France second most, Sweden third most, Denmark fourth most and Norway the least in the group.

In 2014 the Facebook and mobile penetration percentages profiles for Denmark and Norway were very similar.

The next group of aggregates provide a comparison of the 2014 social media network profiles of Germany and Finland.
The 2014 internet population profiles of the Germany and
Finland show that Germany had a larger population of people, internet users and
social media users.


In 2014 Finland had approximately two million people accessing social media on mobile devices.

In 2014 people in Germany spent an average of 1 hour 17 minutes on social media per day.

In 2014 Facebook had the largest number of social network users in Germany and Finland. The social network with the second most was YouTube in Germany and Suomi24 in Finland. The social network with the third most in Germany was Stay Friends and IRC-Galleria in Finland.

In 2014 the population social media penetration percentage in Germany was 64%.

In 2014 the population social media penetration percentage in Finland was 43% and the social media penetration of the total population was 35%.

The snapshots of related aggregates for the UK, Germany and France from the We Are Digital and Mobile Around the World (January 2014) SlideShare.


The next group of 2014 country aggregates are the total
population, total internet users, active social Facebook users, and active
social media users for New Zealand.


In the 2014 New Zealand social media users profile Facebook had the most users, followed by Blogger, then Tumblr and then Twitter.

In 2014 New Zealand had a Facebook penetration percentage of 55% and a mobile social penetration percentage of 44%.

In 2014 India had a much lower population to internet users and active social Facebook users than Australia, Singapore, Philippines and Malaysia.

In 2014 people in the Philippines spent the most time on social media with 4 hours 1 minute per day on social media, followed by Malaysia with 3 hours and 17 minutes, and third was India with 2 hour 26 minutes.

In 2014 the countries Australia, Singapore, Philippines, and Malaysia, Facebook had the highest percentage of internet users who accessed their account in the last month.

In India for 2014 Facebook had the highest percentage of internet users who accessed their account in the last month.

In 2014 for the countries Australia, Singapore, Philippines, and Malaysia, Facebook had the highest percentage of internet users who own an account.

In India for 2014, Facebook had the highest percentage of internet users who own an account.

In 2014 India highest number of users accessing social media on a mobile device with seventy two million.

In 2014 China had a population of 1.3 billion, 590 million internet users, and 623 million Qzone users.

In 2014 people in China spend on average 1 hour 30 minutes on social media daily.

In China for 2014, Sina Weibo had the most internet users who accessed their account in the past month with 62%, followed by Qzone with 53% and Tencent Weibo with 51%.

In China for 2014, Sina Weibo had the most internet users who own an account with 83%, followed by Qzone with 76% and Tencent Weibo with 75%.

In 2014 660 million people in China were accessing social media on a mobile device.

The snapshots of related aggregates for the Australia, China, India and Singapore from the We Are Social Digital and Mobile Around the World (January 2014) SlideShare.


Global Mobile’s share of web traffic
Another related statistic from the We Are Social is the
mobile’s share of web traffic from the We Are Social Digital, Social and Mobile
in 2015 SlideShare.

The statistic can also be represented using the Revolution R Open program as a line.

Global Mobile data growth
Another related statistic from the We Are Social is the
global mobile data growth statistic from the We Are Social Digital, Social and
Mobile in 2015 SlideShare.

This statistic is particularly interesting when analysed with its related web traffic statistics from the Ericsson Mobility Report June 2015 (the report includes statistical methodology notes and many other important internet market related technological updates). The data is downloadable from the Ericsson Mobility Report Website. The statistics can be visualized using line charts created using the Revolution R Open software.
In order to enrich the analysis and illustrate the utility
of our list of statistics, when analyzed and reported on with related
aggregates, it is important to note the key highlight slides in the Ericsson
Mobility Report June 2015 report SlideShare. The first are statistics and
global technology summaries from slide 6.


The second is about key global technology highlights from slide 35.

The first statistic complementary statistic that can be analyzed from the Ericsson Mobility Report June 2015 is the traffic by device subscriptions statistic which can be illustrated using the Revolution R Open line chart. The Ericsson Mobility Report June 2015 statistics (from the report website) include forecasts up to the year 2021.

The second is the subscriptions by technology as shown in the line graph.

The next is the data traffic of smartphone subscriptions for
the regional populations (these are distinct from the global representation
used in the present analysis but may share similarities).

A few key e-commerce, data consumption and device highlights from slide 22 from the 2015 Ericsson Mobility Report June 2015 report SlideShare.

An important technological observation about data consumption and its link to the mobile data growth statistic from slide 24.

An excellent summary of the blending of the possible analyses possible from e-commerce technology data and global statistical aggregates is illustrated in slide 36.

The hundred statistics in our list provide a good statistical framework from which to formulate social media and digital industry statistical content. Firstly the statistical aggregates are available from the Internet World Stats database. The second consideration is that the data have a spatial classification for spatio-temporal analyses of the source variables. The Revolution R Open software with updates and note guides are available from the Revolution Analytics.
The global aggregates and related aggregates were
represented in model form using the Revolution R Open software. The graphs
chosen were the dotchart and the gvisGeoChart functions. The dot chart
represents aggregates using the real line and the gvisGeoChart formulations can
be formulated equivalently. The output from the functions and hence the model
are amenable to mathematical analyses using real analysis, abstract algebra and
discrete mathematics.
In terms of the specific considerations in real analysis are
theorems on:
- Metric spaces
- Convergence and completeness
- Compactness
- Connectedness
- Continuity
- Function Spaces
- Linear Analysis
- The Riemann-Stieltjes Integral
The particularly important theorems include the Bolzano-Weierstrass
Theorem and Banach’s Fixed Point Theorem.
In terms of the specific considerations in abstract algebra are theorems on:
In terms of the specific considerations in abstract algebra are theorems on:
- Groups and Subgroups
- Permutations, Cosets and Direct products
- Homomorphisms and Factor groups
- Rings and Fields
- Ideals and Factor Rings
- Extension Fields
The particularly important theorems and constructs include
the Theorem of Lagrange, The Fundamental Homomorphism Theorem, Fermat’s Little
Theorem, Eisenstein’s Criterion and Maximal Ideals.
In terms of the specific considerations in discrete
mathematics and combinatorics are theorems on:
- Planar graphs
- Euler cycles and Hamilton circuits
- Graph colouring
- Trees
- Travelling salesperson problem
- Minimal spanning trees
- Basic counting
- Binomial identities
- Generating functions
- Recurrence relations
- The inclusion-exclusion formula
The particularly important theorems and constructs include Euler’s
Theorem, Kuratowski’s Theorem, Euler’s cycle Theorem, Hamilton circuit theorems
of Dirac and Grinberg, Brooks’ Theorem, the famous 4-colour Theorem, Binomial Theorem,
linear recurrence relations, inhomogenous recurrence relations,
inclusion-exclusion formula and rook polynomials.
The next step is to incorporate the content marketing
component of the model and its output. This would make use of quantitative and
qualitative content analysis methods customized for writing, e-learning and
business applications. A good example of
business applications include the ideas on slide six of the A Look at the Digital Future of Global Retail by Heike Young published on June 11, 2013.

The statistics and related model output generated using R form a statistical toolkit from which to formulate further statistical content within the same mathematical basis at all times in future (with adjustments where required).
The second feature of the of the statistics is that their
methodology (and data sources), related aggregates (and their methodologies), supporting software materials, supporting
e-learning materials, supporting content marekting materials discussed in this
post all emanate from the SlideShare Real Simple Syndication (SlideShareRSS).
As a statistician this is exciting and wonderful, because all material and analyses associated with this blog post had one
statistical collection technology in the form of the SlideShareRSS. The time
series line graphs, gvisGeoChart graphs, and We Are Social SlideShares all demonstrate
how the model harmonizes with related market spatio-temporal aggregates. This
implies that future data collections, model harmonizations, model output generation
and model output reporting can all be based on SlideShareRSS.
In statistical terms this means that in terms of our list the
blogging technology becomes the optimal technology for all the survey steps of generating
future estimates within the framework, updating the model framework and
reporting the results within an optimised content marketing mix. This idea is
elegantly explained in slide 2 of A Look at the Digital Future of Global RetailSlideShare.

Additionally, one is able to further expand the statistical basis to include other sources and similar harmonizations (like with, for example, the Ericsson report spatial classifications and source datasets). The aim would be to increase the scope and would ideally still be done under the SlideShareRSS collection methodology.
The future results of the framework and the key
considerations in generating statistical content from them will be the topic of
future blog posts.
Want to check out more digital and social media materials from Stats Cosmos blog?

Want to check out more digital and social media materials from Stats Cosmos blog?

Subscribe to our RSS feeds for blog material updates
Blog post RSS feeds

Screencast RSS Feeds

Or get a 25% discount to our exciting training opportunity bundle

Sources:
http://bit.ly/1QWmxss
http://bit.ly/1N4ymLI
http://bit.ly/20TKhBV
http://bit.ly/1N0PWvR
http://bit.ly/1OZu3Uh
http://bit.ly/1O9kfpc
http://bit.ly/1NJjDlx
http://bit.ly/1QDGNiv
http://bit.ly/1SQAQhu
http://bit.ly/1QDGNiv
No comments:
Post a Comment
Thank you for your comment.