

This post is designed for a joint Apache Hadoop 2.6.0 single cluster, Apache Spark 1.5.1 and Ubuntu Server 14.04.3 LTS installation. This is a follow on post to my previous post: How to set up Hadoop Streaming to analyze MovieLens data. In the present post the GroupLens dataset that will be analyzed is once again the MovieLens 1M dataset, except this time the processing techniques will be applied to the Ratings file, Users file and Movies file.
The MapReduce approach has four components. The
first is to integrate the GroupLens MovieLens Ratings, Users and Movies datasets. The second is to design the MapReduce processing model. The third is to design a system for checking the results from the processing for consistency
and accuracy. The last is to summarize/analyze the results.
1. Prepare the data
The Ratings file has the following variables:

The Movies file has the following variables:

The Users file has the following variables:

The three datasets can thus be linked using the UserID variable and the MovieID variable. Essentially, from a processing point of view, each of the columns can be processed together or individually.
For example, the Ratings and MovieID columns can be processed together to generate the average rating for each MovieID. An example of individual processing is using the gender column to generate the number of ratings by female users and male users.
The joint column consideration is the MovieID and Ratings columns. The MapReduce will conducted using a file with the UserID, MovieID and Ratings columns.
The MovieID and Ratings column can also be fused to generate a MovieIDRatings (fused text and number) column that can be used for checking the results. The MapReduce (for this purpose) will be conducted using a file with the fused MovieID and Ratings column.
2. Prepare the mapper and reducer sets
The MapReduce design has two components, a processing component and a checking component.
The MapReduce processing component combines mapper-reducer
sets, Apache Hadoop Streaming and Apache Spark Pipe. The MapReduce processing
model is housed in the mapper-reducer sets. The data is processed using the
mapper-reducer sets within the Apache Hadoop Streaming and Apache Spark Pipe
facilities (of Hadoop and Spark, respectively).
A mapper-reducer set prepared using Perl can be used
with the Hadoop Streaming facility. Mapper and reducer sets prepared in R, Ruby
and Python can be used with the Spark Pipe facility.
The MapReduce checks component firstly runs a joint
column consideration of MovieID and Ratings columns to calculate the Average
Ratings per MovieID (i.e. replicates the Spark Pipe run) in Hadoop
Streaming. The next step is to run Spark Simple Applications prepared in Java and Python on all the column datasets (including
the fused MovieID and Ratings column). The procedure is repeated using SparkR.
The last check is to run the Hadoop Grep worked example on the fused MovieID
and Ratings column data.
Perl mapper-reducer set
The Perl mapper-reducer set was prepared using the tutorial in this post.
The mapper.
The reducer
Ruby mapper-reducer set
The Ruby mapper-reducer set was prepared using the tutorial in this post.
The mapper.
The reducer
R mapper-reducer set
The R mapper-reducer set was prepared using the tutorial in this post.
The mapper.
The reducer
The Python mapper-reducer set
The Python mapper-reducer for the MovieID ratings average set was prepared using the tutorial in this post.
The mapper.
The Python reducer
Once the mapper-reducer sets have been prepared the data can be processed in Hadoop and Spark.
3. Process the data in Hadoop and Spark
In this processing design, the Gender variable is processed in Hadoop using the Streaming facility. The remainder of the variables are processed in Spark using the Pipe facility.
Hadoop Streaming
The Gender variable MapReduce uses the mapper-reducer set prepared in Perl.
Gender variable
In this step one can make the following arrangements/selections.
Input data file: InputData.txt
Input data folder in Hadoop Distributed File System (HDFS): <HDFS Input folder>
Local system mapper folder: <Local system mapper folder>
Local system reducer folder: <Local system
reducer folder>
Hadoop Streaming jar file:
hadoop-streaming-2.6.0.jar
Local system Hadoop Streaming jar file folder:
<hadoop-streaming-2.6.0.jar file local folder>
Output folder in HDFS: <HDFS Output folder>
Mapper file: mapper.pl
Reducer file: reducer.pl
Then one can run the following command on Ubuntu 14.04.3. LTS
This will generate the following results.
Spark Pipe
The data can be processed using the R, Ruby and Python mapper-reducer sets in Spark using the Spark Pipe facility. A simple program can be prepared using the tutorial in this post.
The datasets for the Age, Occupation, Genre and Zip code variables are assumed to have a semi-colon at the end of the values. This is used for the line split for creating the first Resilient Distributed Dataset (RDD) in line 2 of the program.
An excerpt of the first three lines from the Occupations data
file (Occupations.txt) is as follows.
The “;” at the end of each value is placed to match the lines.split(“;”) method in line 2 of the simple program. The files for the other user variables can be prepared analogously for the program.
Occupations
The next step is to make the following arrangements/selections.
Input data file: InputData.txt
Input data folder on local system: <Local system
Input data folder>
Output data folder in local system: <Local system
Output data folder>
Local system mapper folder: <Local system mapper folder>
Local system reducer folder: <Local system
reducer folder>
Mapper file: mapper.R
Reducer file: reducer.R
This will result in the following output for the Occupations variable.

Age
For the Age variable, the Occupation variable Spark Pipe arrangement can be run using the Age variable file as the input data file and the R mapper-reducer set replaced with the Ruby mapper-reducer set.
This will
generate the following results.

Genre
For the Genre variable, the Occupation variable Spark Pipe code arrangement can be run using the Genre variable file as the input data file.
This will generate the following results.

Zip codes
For the ZIP codes variable the Occupation variable Spark Pipe code arrangement can be run using the ZIP code variable file as the
input data file and the R mapper-reducer set replaced with the Ruby mapper-reducer set.
This will generate the following results.

Movie Average Rating
In the case of the Python Average mapper-reducer set
one needs a different Spark Pipe program and a minor modification to the Input
dataset. The colon needs to be used for the line split instead of the
semi-colon at the end of the line (i.e. the data needs to have a colon after
the third column).
The second consideration is the .coalesce(1) transformation in the
pipe in line 5 instead of the .repartition(1) transformation. The coalesce transformation can also be
used for the program for the other Spark Pipe program above (in order to get one data
partition instead of two).
The input data adjustment is to match the lines.split(“:”) method in line 2 of the simple program. One can then run the following simple program.
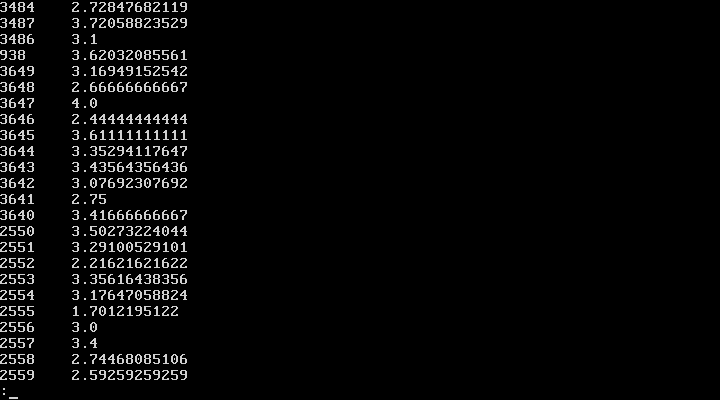
This will generate the following results.

4. Check the results of the processing
It is a good idea to check the results of the
MapReduce before proceeding with the summary. The Spark submit facility, Hadoop
Streaming facility, Hadoop examples, Spark examples and SparkR have some
extremely useful functionalities that can be used for checks.
At the most basic level one can run the Hadoop or Spark wordcount code. In this illustration the approach used makes use of Hadoop Streaming, Hadoop Grep example, Java Simple Application, Python Simple Application and SparkR. The results can be used to check the results from the Hadoop Streaming and Spark Pipe processing above.
At the most basic level one can run the Hadoop or Spark wordcount code. In this illustration the approach used makes use of Hadoop Streaming, Hadoop Grep example, Java Simple Application, Python Simple Application and SparkR. The results can be used to check the results from the Hadoop Streaming and Spark Pipe processing above.
Simple Applications
The code for the Java Simple Application can be
obtained from the Spark 1.6.1 examples website and is as follows for the
gender variable.
For the Simple Applications the following
arrangements can be made:
Input data file: InputData.txt
Input data folder local system: <Local system Input data
folder>
Java Simple Application folder local system: <Java
Simple Application folder>
Python Simple Application folder local system:
<Python Simple Application folder>
Java Simple Application jar file:
SimpleApplication.jar
Python Simple Application file: SimpleApplication.py
Then one can run the following code at
$YOUR_SPARK_HOME/bin for the Java Simple Application check (using the ./bin/spark-submit to execute).
The equivalent code for the Python Simple Application
can be obtained from the Spark 1.6.1 examples website and is as follows.
One can run the following code at
$YOUR_SPARK_HOME/bin for the Python
Simple Application check (using the ./bin/spark-submit to execute).
The code for the Simple Applications can be
adapted to include more variables as required. This is the output that will be obtained
for the Gender variable (i.e. same input file as the Perl Hadoop Streaming) from the Spark submit of the Java Simple Application.
This is the output for the Age variable (Java Simple Application).
This is the output for the Occupation variable (Java Simple Application).
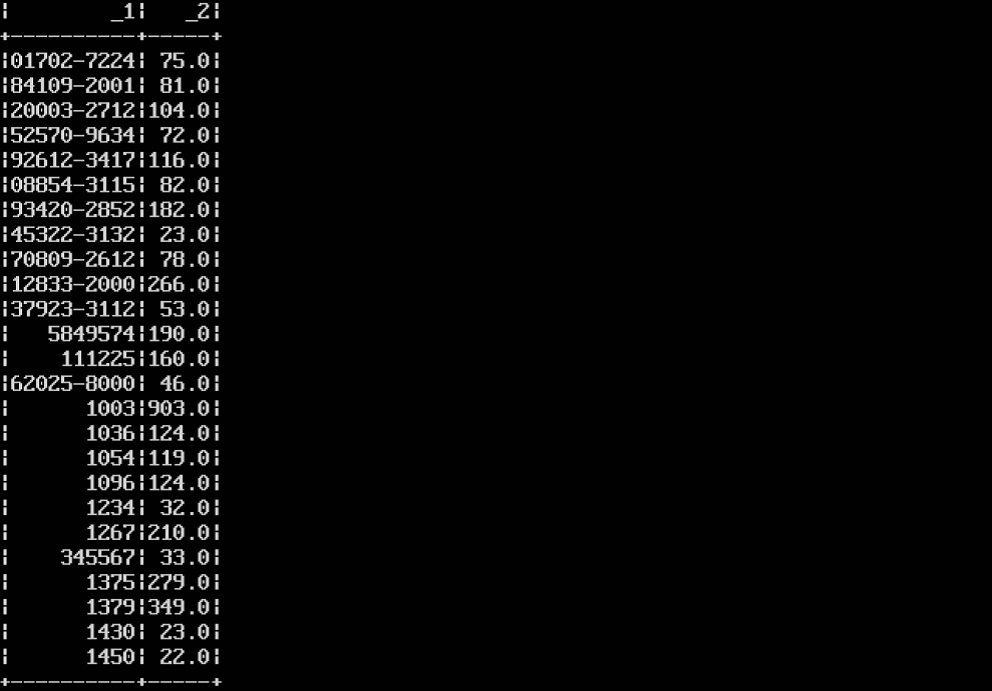
This is the output for the Zip codes variable (Java Simple Application).
This is the output for the Genre variable (Java Simple Application).
This is the output for the fused MovieID and Ratings column (Java Simple Application).
The average for the MovieID can be calculated from the output using
this formula.
where i is the rating and the number of ratings are
obtained from the MapReduce counts (of the fused MovieID-Rating variable).
This is the output obtained using the fused MovieID and
Ratings column for the Python Simple Application.

Apache Hadoop Grep example
In order to run the Hadoop examples Grep code the following arrangements can be made.
Input data file: InputData.txt
Input data folder in HDFS: <HDFS Input folder>
Hadoop Mapreduce examples jar file:
hadoop-mapreduce-examples-2.6.0.jar
Local system Hadoop MapReduce examples folder:
<Local system Hadoop examples folder>
Output folder in HDFS: <HDFS Output folder>
The Apache Hadoop examples Grep code can be run on
the fused column data using the following command outlined in this post.
This will generate the following output.

Ubuntu 14.04.3 LTS and HDFS
The next step is to use Ubuntu 14.04.3. LTS to scroll to the 3645 MovieID average
in the Spark Pipe MovieID average output file for the check. This can be done using the cat | less command outlined in this post.

The next step is to remove the colon at the end of
the line in the UserID, MovieID and Ratings input dataset (i.e. on the right of
the Ratings variable). The input data can then be processed using the Python mapper-reducer set in the Hadoop Streaming arrangement (i.e. Perl arrangement) to obtain the MovieID
average ratings output in HDFS.
The checks above are useful for checking a few
values, however, when one is interested in running structured (and larger) checks
one can use SparkR.
Essentially, the best way of running the checks in
the present scenario is by reading the output datasets from the MapReduce and
running the checks.
The check can be run
using the following simple program obtained from the tutorial in this post, this
post, the SparkR programming guide, the SparkR API documentation and the Spark SQL guide.
SparkR
An alternative method is to run a fresh (and
independent) Spark wordcount from the source data. This can be done by reading
the Gender column, Occupation column, Age column, Zip code column, Genre
column and the fused MovieID-Ratings column into SparkR (individually) from a
local system folder. A SparkR dataframe can then be constructed and used to run
SparkR SQLContext queries.
One essentially needs to make the following
arrangements.
Input data file: InputData.txt
Input Data folder in local system: <Local system
Input data folder>
This is the output for the Gender column (processed individually).

This is the output for the Occupation column.

This is the output for the Age column.

This is the output for the Zip code column.
This is the output for the Genre column.

In the case of the fused MovieID-Ratings column data the above code and additional code needs to be run. The additional code needs to be run in order to get a subset of the results for the counts belonging to the 2831 and 3645 MovieIDs. The additional code is as follows.
This will generate the following output that can be used for the checks.

The tools and their results are extremely useful for
checking the results of the MapReduce. The next step is to generate the results for the summaries/analyses.
5. Summarize/Analyze the data
The MapReduce results can be summarized using bar charts and basic summary statistics. The bar charts can be generated using PROC SGPLOT in the SAS software using the method outlined in this post. The summary statistics from PROC UNIVARIATE in the SAS software can be used to generate some additional checks on the MapReduce results.
The bar chart for the gender variable shows that there are roughly three more times more ratings made by male users than female users.

The additional checks for the Gender MapReduce from the summary statistics are N=2 and Sum Observations
1000209.


The Age code with the most number of ratings is the 25.

The additional checks for the Age variable MapReduce are N=7 and Sum Observations 1000209.

The Occupation
code with the most number of ratings is other or unspecified.

The additional checks for the Occupational variable MapReduce are N=21 and Sum Observations 1000209.

The Genre category with the highest number of ratings is the Comedy genre.

The additional checks for the Genre variable MapReduce are N=301 and Sum Observations 1000209.

The ZIP code with the most ratings is 94110 (San Francisco, California).

The additional checks for the Zip codes MapReduce are N=3439 and Sum Observations 1000209.


The highest MovieID average rating is 5.

The additional check for the MovieID Averages MapReduce
is N=3706.

The post gives a brief illustration of the kind of MapReduce
processing designs that can be applied to the GroupLens MovieLens 1M datasets. I
hope this post proves useful in your big data analyses, especially in the building of Spark Simple Applications.
Interested in other big data and cloud computing resources from the Stats Cosmos blog?
Check out my previous posts?

Check out my previous posts?


Or subscribe to the Stats Cosmos RSS feeds to keep updated

Or check out Stats Cosmos Services
Or check out my course at Udemy College
Or check out the Stats Cosmos blog resources page