

The regional statistics from the splendid Digital, Social and Mobile in 2015 SlideShare by Simon Kemp from We Are Social are an example of one of the most amazing value creation feats of the blogging environment. The slideshare has 1455008 views since publication. In this list we will highlight only sixty-five statistics from the Digital, Social and Mobile in 2015 SlideShare published on January 20, 2015.
The data and statistical methodology sources
for our list are the Internet World Stats website, Ericsson Mobility Report Website, Ericsson Mobility Report June 2015, Ericsson Mobility Report (June 2015) SlideShare, We Are Social Digital, Social and Mobile in 2015 SlideShare and the Digital and Mobile Around the World(January 2014) SlideShare.

The value of the insights and content of the Ericsson Mobility Report can best be summarized by the quotes in the Ericsson Mobility Report (June 2015) SlideShare published in June 2015:
- On slide 10 about the technological aspects of Enabling the Internet of Things
“Growth in the number of connected devices is
accelerating, driven by a growing range of applications and business models,
supported by falling modem costs. A strong foundation for this growth is the
extensive cellular coverage, with an estimated 90 percent of the world’s
population covered”.
- But importantly also on slide 10
“By 2016 the number of smartphone
subscriptions will surpass those for basic phones”
If
we keep in mind these few quotes, consider their statistical content and the empirical basis required
to formulate them then from a writing point of view a desirable property for
our list is firstly a strong empirical basis (to base statements on). The
second property is for our list to have sufficient scope in each study variable in
order to allow us to explore the full range of considerations or headlines
governing the social media and digital statistics industry. This will
increase the value of the statistical content as a resource to users seeking
information.
An
information (modeling) strategy that is usually pursued in practice is to
firstly establish a good mathematical basis from which to formulate social
media and digital statistical content. This is usually followed by the
compilation or development of a statistical toolkit from which to formulate further
statistical content within the same basis at all times in future. This sounds
almost impossible but in statistical terms this is routine. For example, official household surveys track
a country’s population properties over time. Also, a more familiar example, marketing research surveys designed to collect information on
consumer media consumption patterns.
In
similar fashion out list can be tracked over time and the information updated
according to developments in the industry group.
In
our list, the first thirteen statistics constitute the empirical basis and core
scope of the list, namely, the global population and its regional divisions.
The remainder of the statistics focus on broadening and sharpening the focus of
the list in line with the most relevant statistical content creation aims in
the digital and social media industry. The task is however performed within the
important but subjective sample survey (Bayesian modeling) parameter of
limiting the list to presently available information from the Internet World
Stats database. The database does, however, allow for general statements about
the following topics at the global and regional levels:
- The Internet of Things
- Social media penetration
- Mobile penetration
- Mobile social penetration
- Data traffic
- Device usage
In
summary, the list is a structured statistical framework that can be used to
track digital and social media statistics. The list has been tested and
analyzed spatio-temporally for the 2014 and 2015 snapshots.
The
most important property, however, of our list is that it is a blogger’s list.
As a blogger’s list all its aspects can be easily understood and implemented
using blogging techniques. The list can be easily customized to one’s writing, content creation and blog posting needs as required. The post details how one can do
this using survey sampling methodology and statistical graphics on the Revolution R Open software.
1. Statistic one: Global population
The
first statistic in our list is the 2015
global population statistic of 7.210 billion as presented in the
Global Digital Snapshot of the We Are Social Digital, Social and Mobile in 2015
SlideShare.

The first step in constructing a statistical list is to define the population. The considerations include data and other information sources. In this case the easiest model is that of the global aggregate, namely, all of us.
In
modeling, the next step usually involves selecting a software that one can use
to conduct computer based model management functions like evaluation,
experimentation, and data analysis.
In this
post the mathematical software selected was the Revolution R Open program (free
download). The specific functions selected from the software to represent the
information was the line chart, dotchart and gvisGeoChart. The line chart was selected
because of its advantages in representing time based observations on the real
line. The dotchart function was selected for its ease in representing
comparisons across the aggregates of dis-aggregations of populations (or simply
many populations) on a single scale on the real line. This feature of the
dotchart is a critical and important component of our modeling as will be
illustrated in the conclusion. The gvisGeoChart also has the same analogous
property extended to spatial representations.
In the
mathematical basis the first statistic and its related statistics can be
formulated using the Revolution R Open software dotchart from the Revolution R
Open graphics package.
The chart
has a heading, a group (which is coloured blue), unit of measurement (scale on
the real line) and a row/column statistical variable specification. In the dotchart
constructed, the aggregate refers to the value of 7.62, active internet users
to 3.010, active social media accounts to 2.07 similarly for social media
accounts and mobile social media counts. The dotcharts presented can be
interpreted similarly and can be seen as an account of how the data appears
inside a statistical computation software framework.


The global population aggregate can be compared to its predecessor in the We Are Social Digital and Mobile Around the World (January 2014) SlideShare published in January 7, 2014.

This is a good statistical consistency exercise but also more importantly a key foundation for spatio-temporal analyses of the global population aggregate (as will be illustrated in our list).
In
blogging terms as the first step we have defined a statistical population and
four statistical variables we are interested in for content creation, namely,
the population in a geographic boundary (our main population), its internet
use, its social media users, and its mobile subscriptions. In the present
analysis the SlideShares can be received via Real Simple Syndication (RSS)
through a reader and thus all information contained in this post is available
via RSS feed. In e-commerce terms this means that in our list and its modeling
there are minimal data collection and management costs (money and time), good
reliability and a vast supporting knowledge base for customization of the
results. The resulting 2014 population figure and its properties can be
represented in a dotchart.

As promised in the introduction, the regional aggregates to complete the core of the list or foundation.
2. Statistics two to thirteen: (Twelve) Regional populations
The next
twelve statistics in our list are the regional
breakdowns of the 2015 global user statistic. The world can be divided into
twelve geographic regions each with a statistical aggregate representing the
user population. In the same way the global population was modeled in the
first statistic, now, we can model each population in the twelve geographic
regions analogously. Additionally, this is done as part of the framework of the
global aggregate. This modeling strategy is desirable because the global
model’s data is easier to assemble and its analysis requires less operations.
The strategy is also desirable because once the global model’s empirical basis
has been firmly established, then there are many academic and non-academic
educational resources (free and charged) that can be used to extend the basis
to the constituent dis-aggregations (sub-populations).
In our
core statistics list we navigate through the same study variables as in the case
of the global statistic. These twelve statistical aggregates are the regional statistics in our list title.
The twelve breakdowns suggested by the We Are Social Digital
and Mobile Around the World (January 2014) SlideShare with 1511343 views and
Digital, Social and Mobile in 2015 SlideShare are:
- North America
- Central America
- South America
- Western Europe
- Middle East
- Africa
- Eastern Europe
- Central Asia
- South Asia
- East Asia
- Southeast Asia
- Oceania
The
statistics are compiled from the Internet World Stats database which also provides the accompanying methodology (including
metadata for definitions).
In order
to explore the empirical power of the mathematical methodology we shall use a
statistical modeling procedure that combines our list’s information from the
Internet World Stats database and the information from the We Are Social
Digital, Social and Mobile in 2015 SlideShare (for social media and mobile
connections). The first step involves developing a way to
group our
regions using the same countries (or country populations) as that in the We Are
Social Digital, Mobile and Social in 2015 SlideShare.
In our
formulation this is easy to do, because all our formulations are based on the
global population. The method can be formulated in a variety of ways. The
method applied in the present analysis was the Bayesian approach. This is advantageous to apply in this setting because of the
amount of readily available academic literature on the topic.
In
statistical graphics terms in order to use the list of regional estimates one
needs to construct a regional country classification or spatial classification that results in data from
a statistical population that mimics or is
extremely similar to the We Are Social Digital, Social and Mobile in 2015
SlideShare population.
In
statistical terms this means that the We Are Social Digital, Social and Mobile
in 2015 aggregates are taken to be the correct totals for our (Bayesian) estimation
purposes, namely, statistical content creation. The Internet World Stats database
global population is thus taken to be the source population but also the main
population.
Once
this is done we then load the data for the statistical population like we did
for the global aggregates into the Revolution R Open software. This time,
however, we also have the information from the spatial classification. The
package selected for this illustration of the regional aggregates was the gvisGeoChart function from the Revolution R Open
Software googleVis package.
The
statistics in slide 8 of the We Are Social Digital, Social and Mobile in 2015 can
be captured and a regional statistics aggregate table created for the total
population, internet users, active social media accounts and mobile connections
variables.

The spatial representation can take on the form of a map with certain constraints. The spatial depiction of the population regional aggregates (yellow boxes) can be shown on a map using the gvisGeoChart function. Each country is allocated a colour according to the value of its parent regional statistic. For example since the regional population aggregate as percentage of the global population aggregate for North America is 5% then all countries in North America get the colour of 5% (on the real line). The regional aggregates in the blue, green and red boxes of the 2015 aggregate can be shown on respective maps. The map of the population regional aggregates.

The map of the internet user regional aggregates.

The map of the active social media accounts regional aggregates.

The map of the mobile connections regional aggregates.

The map of the population regional aggregates can be further subdivided into individual country populations and these used to calculate country population based weights using the formula (for say M countries):
The resulting weights for all the countries can be mapped using the gvisGeoChart function.

Analogously, to the global aggregates the twelve regional statistics aggregates can be explored in time by comparison with the Digital and Mobile Around the World (January 2014) SlideShare.

The map of the population regional aggregates.

The map of the internet user regional aggregates.

The map of the active social media accounts regional aggregates.

The map of the mobile connections regional aggregates.

The advantage of the mathematical and spatial formulations is that the properties of the populations (or survey variables) at the regional statistics levels of aggregations can be represented similarly. This results in very interesting real line based spatio-temporal visualizations of the data.
3. Statistics fourteen to twenty-five: 2015 Regional internet use
The fourteenth to twenty-fifth statistics
in our list are the We Are Social Digital, Social and Mobile in 2015 SlideShare regional internet use statistics.

The internet use regional statistics can also be compared with their 2014 counterparts from the Digital and Mobile Around the World (January 2014) SlideShare.

The two regional statistics groups can be summarized in two spatial representations using gvisGeoChart. The map of the 2015 regional aggregates.

The map of the 2014 regional aggregates.

The spatio-temporal evolution of the regional statistics can be seen to show a general global increase in internet penetration. This can be presented in the following information scheme: aggregate specification of the change using a table and a spatial representation of the change using a graphical map.
Table
The table shows the regional
internet penetration percentage for 2015, regional internet penetration
percentage for 2014, percentage change in internet penetration in difference
terms and the change in index terms using the
formula:


It is once again important to note that each of the table figures can be represented as values on the real line as in the case of the line chart, dotchart and gvisGeoChart.
Graphical
map
The map of the percentage
differences.

The map of the indexed differences.

The first thirteen statistics constitute the core part of our list. The present twelve statistics (statistics fourteen to twenty-five) and the remaining statistics are classified as related statistics. The core statistics and their related statistics can be tracked, analysed and reported on using updated data. The results of this update exercise will be the topic of a future blog post. The remaining set of statistics in our list explore other sets of related statistics that can be incorporated into the core list to enhance its functionality.
4. Statistic twenty-six: 2015 Global share of web traffic by device
The twenty-sixth statistic in our
list is the We Are Social Digital, Social and Mobile in 2015 SlideShare share web traffic by device statistic.

The statistic can be represented with its properties using a dotchart.


5. Statistic twenty-seven: 2015 Global social media use
The twenty-seventh statistic in our list is the We Are Social Digital, Social and Mobile in 2015 SlideShare social media use statistic which summarizes the social media usage properties of the global internet user population.

The statistic, like the previous (related) statistics, can be have its properties represented using a dotchart.


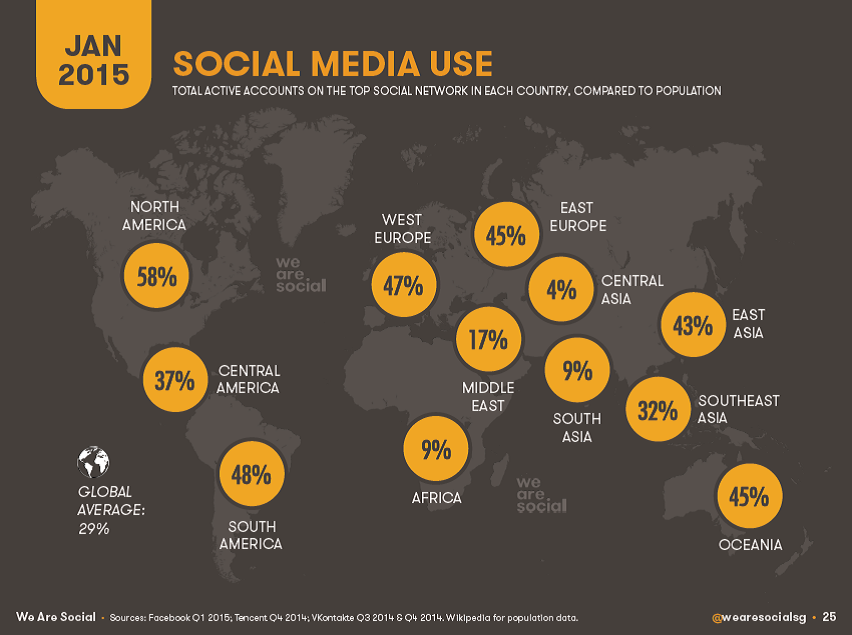
6. Statistics twenty-eight to thirty-nine: 2015 Regional social media use
The twenty-eighth to thirty-ninth statistics in our list are the We Are Social Digital, Social and Mobile in 2015 SlideShare regional social media use statistics as measured using the total
number of active accounts on the top social network in each country compared to
population.
This statistic group is great to analyze with the We Are Social Tweets on technological developments like:
We Are Social "Facebook
officially launches Notify, an app for reading customized breaking news from
over 70 publishers." 12 November 2015, 2:38 p.m. Tweet.
The social media use regional
statistics can also be compared with their predecessor group from the Digital
and Mobile Around the World (January 2014) SlideShare.


The regional social media use statistics for 2014 and 2015 can be represented spatially on the Revolution R Open gvisGeoChart.

The map of the 2015 regional social media use aggregates.

The map of the 2014 regional social media use aggregates.

7. Statistics forty to forty-seven: Top eight social networks
The fortieth to forty-seventh statistics
in our list are the We Are Social Digital, Social, and Mobile in 2015 SlideShare
top eight social platforms statistics according
to monthly active user accounts by social platform.

The eight statistics can also be represented using a dot chart.

The eight statistics can also be compared to their 2014 counterparts from the We Are Digital and Mobile Around the World (January 2014) SlideShare.

The predecessors can be represented in a dot chart for comparison.

The eight statistics for the two years can also be compared to generate a year-on-year comparison of the social network market concentration indices in tables. The concentration indices or metrics calculated are the total active users of the top eight, sum of market shares of the top eight (in top ten market), the Herfindahl-Hirschman index, Tideman-Hall-Foldvary inequality index, Gini-coefficient, Tideman-Hall index and Theil index.


It is important to note that each of the table figures can be represented as values on the real line as in the case of the dotchart and gvisGeoCharts.
8.
Statistics forty-eight to fifty-nine: 2015 Global mobile social use
The forty-eighth to fifty-ninth statistics
in our list are the Digital, Social and Mobile SlideShare in 2015 regional mobile social use statistics of the active accounts on the top
social network in each country accessing via mobile, compared to the population.

The regional classification statistics values can be represented spatially on a map.

The regional classification percentages can also be expressed in user account aggregates form as in the Digital, Social and Mobile in 2015 SlideShare.

The map of the mobile social regional statistics in user account aggregates form.

9.
Statistic
sixty: 2015 Global mobile users versus connections
The sixtieth statistic in our
list is the We Are Social Digital, Social and Mobile in 2015 SlideShare global mobile users versus connections statistic
which summarizes the mobile user and connections properties of the global
population.

The statistic’s properties can be represented using a dotchart.

10.
Statistic
sixty-one: 2015 Global mobile users phones
The sixty-first statistic in our
list is the We Are Social Digital, Social and Mobile in 2015 SlideShare global mobile phones statistic based on
the number of cellular connections (rather than unique users).

The statistic can be have its properties represented using a dotchart.

11. Statistic sixty-two: 2015 Global connections by device
The sixty-second statistic in our
list is the We Are Social Digital, Social and Mobile in 2015 SlideShare global connections by device statistic based on
the number of smartphone connections around the world.

The statistic’s properties can be illustrated using a dotchart.

12.
Statistic
sixty-three: 2015 Global mobile’s share of web traffic
The sixty-third statistic in our
list is the mobile’s share of the web
traffic statistic from the We Are Social Digital, Social and Mobile in 2015
SlideShare.

The statistic can also be represented using the Revolution R Open program as a line chart. It is also important to note that line charts also represent their values on the real line.

13.
Statistic
four: 2015 Global platforms’ share of mobile web
The sixty-fourth statistic in our list is
the We Are Social Digital, Social and Mobile in 2015 SlideShare global platforms’ share of mobile web statistic based
on each platform’s share of global mobile web page requests.
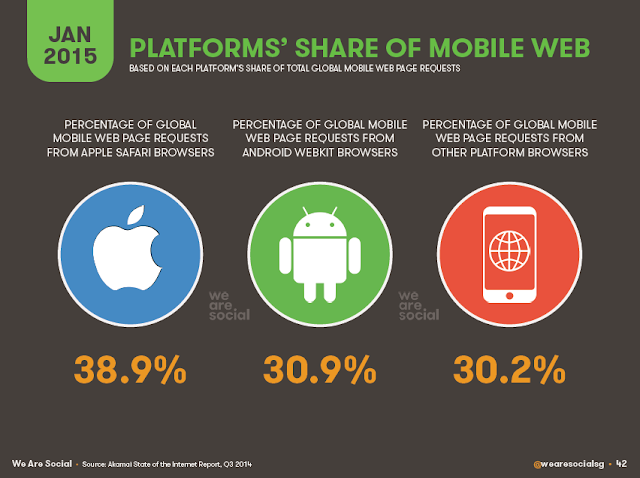

The statistic’s properties can be represented on a dotchart.

14.
Statistic
sixty-five: 2015 Global Mobile data growth
The sixty-fifth statistic in our list is the global mobile data growth statistic from the We Are Social Digital, Social and Mobile in 2015 SlideShare.

This statistic is particularly interesting when analysed with its related web traffic statistics from the Ericsson Mobility Report June 2015 (the report includes statistical methodology notes and many other important internet market related technological updates). The statistics can be analyzed using line charts created using the Revolution R Open software.
In order to enrich the analysis and illustrate the extreme
usefulness of the regional statistics when analyzed and reported on with
related aggregates it is useful to highlight some of the key statistics in the Ericsson
Mobility Report June 2015 report SlideShare. The first are statistics and
global technology summaries from slide 6.

The second is slide 32 about internet traffic and live events.

The third is slide 33 about internet traffic and live events.

The fourth is slide 34 about internet traffic and
live events.

The fifth is slide 35 about the global key highlights of the report.

It is also good to look at slide 5, slide 36 and slide 39 from the We Are Social Internet of Things SlideShare published on November 12, 2015.


The Ericsson Mobility Report June 2015 statistics used in the comparison with the statistics in our list include device subscriptions as calculated from the Ericsson Mobility Report dataset available from the report website.
The first complementary statistic that
can be analyzed from the Ericsson Mobility Report June 2015 is the subscriptions by device statistic which
can be illustrated using the Revolution R Open line chart. The Ericsson
Mobility Report June 2015 statistics include forecasts up to the year 2020.

The second is the internet data-traffic by application as shown in the line graph.

The next is the subscriptions by regional populations (these are distinct from the regional representations used in the present analysis but may share similarities).

An excellent summary of the exquisite blending of the insights possible from e-commerce technology data and global statistical aggregates is illustrated in slide 36 from the 2015 Ericsson Mobility Report June 2015 report SlideShare.

The sixty-five statistics in our list provide a good mathematical basis from which to formulate social media and digital statistical content in that the statistical aggregates are available from the Internet World Stats database. The data have a spatial classification for spatial and time series analyses of the source variables.
The statistics form a statistical toolkit from which to
formulate further statistical content within the same basis at all times in
future. This is so because if one can use the available methodological reports,
harmonize the Internet World Stats database spatial classification with We Are
Social spatial clssification used in the SlideShares then all the statistics
considered in our list from We Are Social are applicable to our statistical population.
Additionally, one is able to further expand the statistical
basis to include other data sources and similar harmonizations (like with, for
example, the Ericsson spatial classifications and source datasets).
The global aggregates and related
aggregates were represented in model form using the Revolution R Open software. The graphs chosen were the line chart, dotchart and the gvisGeoChart functions. The line chart represents aggregates using the real line. The dot chart also represents aggregates using the real line and the gvisGeoChart representations can be formulated analogously. The output from the functions and hence our statistical aggregates model can be analyzed mathematically using real analysis, abstract algebra and discrete mathematics.
In terms of the specific considerations in real analysis are theorems on:
In terms of the specific considerations in real analysis are theorems on:
- Metric spaces
- Convergence and completeness
- Compactness
- Connectedness
- Continuity
- Function Spaces
- Linear Analysis
- The Riemann-Stieltjes Integral
The particulary important theorems include the Bolzano-Weierstrass Theorem and Banach's Fixed Point Theorem.
In terms of the specific considerations in abstract algebra are theorems on:
In terms of the specific considerations in abstract algebra are theorems on:
- Groups and Subgroups
- Permutations, Cosets and Direct products
- Homomorphisms and Factor groups
- Rings and Fields
- Ideals and Factor Rings
- Extension Fields
The particularly important theorems and constructs include the Theorem of Lagrange, The Fundamental Homomorphism Theorem, Fermat's Little Theorem, Eisenstein's Criterion and Maximal Ideals.
In terms of the specific
considerations in discrete mathematics and combinatorics are theorems on:
- Planar graphs
- Euler cycles and Hamilton circuits
- Graph colouring
- Trees
- Travelling salesperson problem
- Minimal spanning trees
- Basic counting
- Binomial identities
- Generating functions
- Recurrence relations
- The inclusion-exclusion formula
The particularly important theorems and constructs include Euler's Theorem, Kuratowski's Theorem, Euler's cycle Theorem, Hamilton circuit theorems of Dirac and Grinberg, Brooks' Theorem, the famous 4-colour Theorem, Binomial Theorem, linear recurrence relations, inhomogenous recurrence relations, inclusion-exclusion formula and rook polynomials.
The next step is to incorporate
the content marketing component of the model and its output. This would make
use of quantitative and qualitative content analysis methods customized for
writing, e-learning and business applications.
The statistics and related model output generated using the Revolution R Open software form a statistical basis from which to formulate further statistical content within the same mathematical basis at all times in future (with adjustments where required) as the the social media and digital industries evolve.
The second feature of the
statistics is that their methodology (and data sources), related aggregates
(and their methodologies), supporting
software materials, supporting e-learning materials and supporting content marketing
materials discussed in this analysis were all obtained from the SlideShare RSS (SlideShareRSS).
As a statistician this is magnificent, because all material analyses associated with this blog post had one statistical collection technology in the form of the SlideShareRSS. The time series line graphs, gvisGeoChart graphs, and We Are Social SlideShares all demonstrate how our analysis model harmonizes with related spatio-temporal aggregates. This implies that future data collections, model harmonizations, model output generation and model output reporting can all be based on the SlideShareRSS statistical collection technology. The future observation and analysis of SlideShareRSS as a statistical data collection technology will be reported on in a future blog post.
Essentially, this means that in
terms of our list the blogging technology is the optimal technology for all the
statistical processes for generating future estimates within the framework,
updating/elaborating on the model statistical framework and reporting the
results within an optimal content marketing mix. This idea is not new as can be
seen in the Using Rss by Britt Watwood (Virginia Commonwealth University) published on January 25, 2008.

An interesting statistic not included in our list is the ASEAN’s internet user statistic from slide 51 from the We Are Social Social Mix SlideShare published on August 3, 2015.

An interesting recommendation from slide 109 from the We Are Social Social Social Mix SlideShare.


