

Internet usage, social media usage and digital technology usage are becoming pervasive in our lives. We see this trend everywhere we go, for example on television, our household appliances, medical services, motor vehicles and even fashion. Have you ever wondered how this can be described or expressed using numbers? For example, if you are like me and each day you go on Twitter and you open your username, browse through hashtags, follow people and see people following you. Other examples include pin boards on Pinterest, your Facebook page and your blog’s Facebook page.
I am sure if you have done this and seen numbers quoted on various
newspapers, internet pages and maybe even on television, you must think I could
never do that. Well I agree this might be true for numbers that are difficult
to calculate like those presented by Google, Yahoo, the Ericsson Mobility Report, Facebook, Twitter, Pinterest and others. Did you, however, think that
you could calculate your own numbers based on the resources that you have, and
still have those numbers being meaningful/relevant to your own life?
In this list this is what I am going to show you how to do. I do
not profess that the numbers will necessarily meet all your expectations at
first but we can at least cover the basics. In the event that they do not, I am
sure that they will at least point you in the right direction to get the
numbers that you need.
1. Global population trends for 2016 and beyond
The first trend we will explore
is that of the global population. We will first cover the basic properties of
the aggregate and then explore how we can extend those properties into a trend
for 2016 and beyond. An excellent template for characterizing the global
aggregate and its properties are the We Are Social SlideShares. The one that I
have picked for this list is the Digital, Social and Mobile in the APAC for 2015 (195 771 views) published on March 15, 2015. The SlideShare is an
excellent resource for expounding key methodological considerations when
studying trends as we shall see in our list.
The first slide we
explore is the global digital snapshot containing the global population
aggregates as at March 2015. These are the global population of 7.219
billion, active internet users of 3.038 billion, active social media users of
2.126 billion and active mobile social users of 1.753 billion. The active
internet user, social media user, unique mobile user and active mobile user
aggregates can also be considered/expressed in penetration form with figures of
42%, 29%, 51%, and 24%, respectively. The other important property of the
aggregate is the level of urbanization at 53%.

The other important properties of the figure that are useful to consider include the number of You Tube videos watched daily of 8.4 billion in slide 10 and the number of global mobile connections of 7.1 billion in slide 14.
The aggregate and its properties considered so far can be
illustrated using the Revolution R Open graphics package dotchart function and
googleVis package gvisGauge function.


These figures can be illustrated using
the googleVis package gvisPieChart function.

The next set of aggregates, 20 in total,
describe the social platform use of the global population. The social platform
activities, based on the most recently published monthly active user accounts (in March 2015) are shown in slide 12. The social platform activity is further categorized
according to whether the social platform is a social network or a
Messenger/CHATAPP/VOIP. The graph has the appealing property of being
multidimensional in illustrating the combined activity of both social platform membership sub-categorizations
simultaneously. A key figure to note, at this stage, in terms of our list is the
1415 million figure of active Facebook accounts.

These figures can be illustrated using the googleVis package gvisBarChart function.


The next group of figures
summarize the daily social media activity of the global population in the form
of the daily number of Video views on Facebook, Messages sent via WhatsApp,
Tweets posted on Twitter and Photos & Videos uploaded to Instagram. The respective
figures being 3 billion, 30 billion, 755 million and 70 million, respectively.

The figures can be
expressed using the googleVis package gvisPieChart function.

In slide 13 we encounter information that can be used to bring a technological flavor to the global social media consideration. This involves looking at the types devices used by the global population Facebook users to access their accounts.

The figures (aggregates and their respective percentages) can be expressed using the googleVis package gvisPieChart function.

In order to convert all the information considered into a trend it is useful to consider the information in the context of a geodatabase. The global geodatabase considered in this list is the Internet World Stats database. The database contains information from all the countries for the population and internet user population variables.
The database is arranged into a spatio-temporal format where
information is collected/presented as a series of global snapshots. In our
trend formulation, this is where statistical data collection methodology,
process analysis, and methodological harmonization are critical. The database methodological notes for its compilation and how it can be used can be found on
the Internet World Stats website.
The first feature of the database is that it is updated
continuously as data becomes available. The first methodological strategy is to
determine the snapshots which contain the most up-to-date information for all
the countries. This firstly, homogenizes the information according to the time
variable for trend analysis purposes and also allows for the derivation of the
global population aggregation under our list.
The time periods considered in the present illustration are years (starting on January, 01) 2008 to 2014. This ensures (with a high probability) that all information considered
in the year-end snapshots pertain to the global population as all available
country information for all countries would be included for that year. If this
is not achieved then the process would involve searching for the next (or neighboring the) snapshot
where this requirement is fulfilled, namely, looking for the values of the component
aggregates that need to be updated in the snapshots of the following year.
In our case, the snapshots considered for 2008 to 2014 can be
expected to, or simply, allow for the compilation of the most up-to-date
information for all the countries for each of the years. The information is additionally
homogeneous in terms of time when pertaining to global population estimates.
The closest homogeneous snapshot to the March 2015 time point is
the 31 December 2014 snapshot. The last snapshot of the year ensures that the global population as
defined in the We Are Social SlideShare and the Internet World Stats database
are harmonized (albeit at different time points based on the information
considered so far). The Internet World Stats 31 December 2014 population
weights can be mapped using the googleVis package gvisGeoChart function. The
country weights can be derived using the formula (for say M countries and year j):


The synchronization of the two global populations in terms of time (December 2014 and March 2015) is achieved through the SAS software Proc forecast statement using the time homogenized Internet World Stats database annual aggregates for 2008 to 2014. The December 2014 population and internet user populations can be forecasted into the future. The populations can also be predicted for past and present values.
This time-homogenized
global population set of forecasts is our first trend for 2016 and beyond.


2. Regional Trends for 2016 and beyond
Now that the basic methodological considerations have been considered. The next step is to apply the procedure to each of the regional trends in order to obtain the remaining trends for 2016 and beyond. We again begin with the aggregates at 31 December 2014 from the Internet World Stats database.
The first set of
aggregates is the regional population dis-aggregations of the global population
(12 aggregates). The second set of aggregates is the regional internet
user population dis-aggregations of the global population (12
aggregates). The regional dis-aggregations were constructed from the
Internet World Stats database, United Nations Country/Regional classification
and harmonized using Bayesian methods to correspond to the We Are Social aggregates. The 12 regional classifications are as follows:
- North America
- Central America
- South America
- Western Europe
- Middle East
- Africa
- Eastern Europe
- Central Asia
- South Asia
- East Asia
- Southeast Asia
- Oceania
The regionally classified
population data for the 2014 time-homogenized snapshot can be mapped using the
gvisGeoChart function.

The corresponding internet user population for the 2014 time-homogenized snapshot can be mapped using the gvisGeoChart function.

The next step is to set up the We Are Social and Internet World Stats data in order to apply the Structure Preserving Estimation procedure to the regional populations.
The approach involves
using the regional aggregate information on the regional global shares,
internet penetration, social penetration, mobile social penetration, cellphone
connections and mobile broadband penetration from the We Are Social Digital,Social and Mobile in 2015 SlideShare. It is worth noting, at this stage, that
the internet penetration homogenization between the two populations for the
internet use variable is not required because internet user population information is
available on the Internet World Stats database. Hence the internet penetration
can be derived using the population forecast and the internet user population
forecast. The procedure is repeated in order to derive an alternative set of
estimates using an alternative methodology.


These can be combined with the corresponding penetrations from the
We Are Social Social, Digital & Mobile Around The World 2014 SlideShare to generate annual
penetration growth measures. The annual growth measures can be calculated using the
following formula for each penetration, so for penetration j between times k and i:

The Mobile Social penetration measures can be given a
growth factor of 1 or simply a growth rate of 0, because they are not
available as part of the We Are Social Social, Digital & Mobile Around The World 2014 SlideShare. Thus the
modeling assumption is that the penetration rates did not grow. This assumption
is unlikely to hold but it can be made as no other source is included in the
present analysis. In terms of my promise at the start of the list, this can be
seen as a limitation in my approach and a pointer in the right direction for practitioners needing
to analyse Mobile Social trends.


The penetration data from the We Are Social Mobile,
Social, and Mobile in APAC Slide Share for March 2015 can again be used as
estimation controls.


The We Are Social and Mobile January 2015 penetrations
are grown to March 2015 using the formula:

The penetrations can be mapped using the googleVis package gvisGeoChart function. In this section, namely, the regional section, each country is colored and given aggregate values of the region rather than the country color/value. In cases where different rules apply these will be indicated when the graphs/maps are presented.
The resulting map for the internet penetration.

The Social penetration.

The Mobile Social penetration.

The Mobile connections penetration.

The Mobile Broadband penetration.

The resulting penetrations can be compared to the controls from
the We Are Social Digital, Social, and Mobile in APAC in 2015 SlideShare. In
the case of the internet penetration the following mapped differences can be
observed.

The differences can be analyzed using a table. A table of
deviations, their means and standard deviations can be used to obtain a rough gauge of the
goodness of fit. The resulting table for all the penetrations.

The alternative
internet penetration had a mean deviation by region of 0.01. The best fitting
penetration in mean and standard deviation terms was that of the Social
penetration.The Mobile broadband penetration had the poorest fit even compared
to the Mobile Social penetration which was not adjusted. The feature of the
mobile broadband penetration, however, is that all the differences had the same
sign which indicated a systematic overestimation. This can be fixed in
aggregate terms by adjusting the growth factor.
The high standard
deviation, however, will be more difficult to adjust for. An observation of the
rates, however, shows that a method might be the Mobile Social approach of no
adjustment (at least for the present analysis). Yet, still another approach is
a more detailed analysis of the changes in the rates over time from collections
of data from We Are Social or other data sources.
The other trend that can be explored is the Facebook account user trend from the Internet World Stats
database Facebook 2012 country level estimates. In this approach the country
level data from the Internet World Stats database can be used to generate weights
analogous to the country weights in the global population. The weights can then be used with the Facebook figure of 1415 million users in March 2015 from the Mobile, Social, and Mobile in APAC Slide Share to generate country level Facebook account estimates (using the ratio estimation
method).

The Facebook 2012 country estimates can be
illustrated using the googleVis gvisGeoChart function. In this case the country valuein the map is the value for the country rather than that of the region as done in the other regional gvisGeoChart function plots in our list.

The resulting ratio estimates at the country level
can then be aggregated to regional estimates. This approach is used because
regional estimates will tend to be more robust to assumption deviations. The
prudent approach is taken in this case because the Facebook estimates are based on weights
from 2012. In summary the structure of the Facebook accounts can be expected to
change less in aggregate terms than at an individual country level. This too,
is another pointer for more data to enhance the trends.
The resulting gvisGeoChart with the country color/value being the regional value rather than the country value as in the other regional gvisGeoChart function maps.
The resulting gvisGeoChart with the country color/value being the regional value rather than the country value as in the other regional gvisGeoChart function maps.

The regional trend considerations, thus far, thus
illustrate how to attach the March 2015 penetrations to population rates forecasted
from the Internet World Stats time-homogenized population estimates (between
2008 to 2014). As in the global aggregate method the regional internet penetrations can be calculated using forecasts and
using the Structure Preserving Estimation method.
The next step is to generate the forecasts using the
Proc forecast statement from the SAS software. I have derived the 1 January
2016 population estimates for 10 days time which we will count down to when we are counting
down for the Happy New Year celebrations. I have also included 95% upper and
lower confidence intervals and mapped them using the googleVis package
gvisGeoChart function.
The estimates at the regional level.

The lower 95% confidence interval.

The upper 95% confidence
interval.

The corresponding estimates for internet user population in ten days' time (01 January 2016) were also derived. The estimates were similarly mapped in the googleVis
package gvisGeoChart function.
The estimate.

The lower 95% confidence
interval.

The upper 95% confidence interval.

The population and
internet user forecasts which constitute the remaining 12 trends for 2016 and
beyond were generated using the Proc forecast procedure of the SAS software.
The corresponding estimates for population on 07 January 2017were also derived as a proxy to 31 December 2016. The estimates were similarly mapped in the googleVis package gvisGeoChart function.
The estimate.

The lower 95% confidence interval.

The upper 95% confidence interval.

The Population forecasts for 2016 and by region.


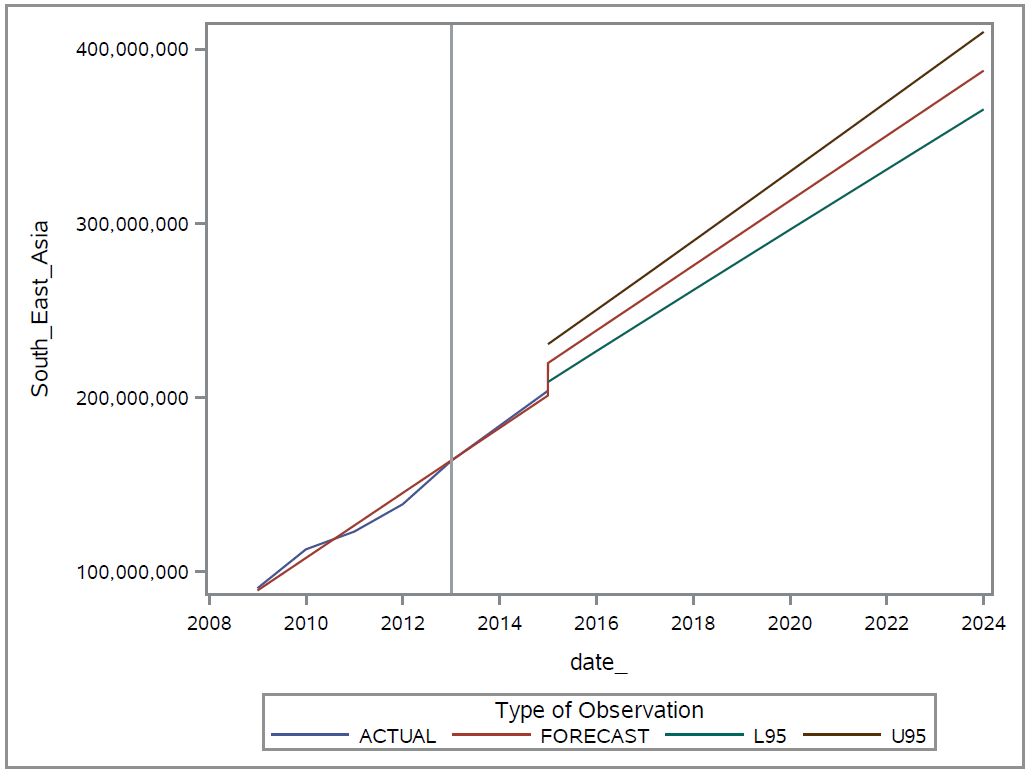
Internet usage forecasts
up to 2024 by region.


The methodology can be further extended
to include dis-aggregations of the regions to country level estimates. The five
countries selected were USA, Mexico, Colombia, Sweden and UK. The country level
information for Mexico, USA, and UK can be obtained from the We Are Social
Digital, Social Digital, Mobile and Social in 2015 SlideShare. The methodology
is illustrated for January 2015 for the population and internet
use/penetration properties but can be applied analogously to any time point or
digital industry variable/penetration in 2016 and beyond. The methodology can
also be illustrated for other countries using the population and internet
population forecasts.
The accompanying population forecasts to
2024 for each country.


Internet users forecasts up to 2024 for each of the
countries.


Useful to wrap up with slide 25 and slide 35 from the Ericsson Mobility Report June 2015 SlideShare.


In terms of our forecasts
the global population will be roughly 7.8 billion in 2020. In the context of the Ericsson Mobility
Report June 2015 forecasts there will be 9.2 billion subscriptions. This will
amount to a mobile subscription rate/penetration of roughly 119%. There will be
7.7 billion Mobile Broadband subscriptions which will amount to a mobile
broadband penetration of 99%. Roughly 6.98 billion people will be using
WCDMA/GSM technology and roughly 5.4 billion people will be on LTE. More than
twice of the subscriptions will be smartphone and there will be 9 times more
mobile data traffic which will be driven by video.
Want to check out more digital and social media materials
from Stats Cosmos blog?
Check out our other blog posts and screencast series.


Subscribe to our RSS feeds for blog material updates
Blog post RSS feeds

Screencast RSS Feeds

Or get a 25% discount to our exciting
training opportunity bundle

Do you have statistical products to
sell?
Why not try selling them on Amazon?
